Histogram
Histogram counts captured channel values. It shows their distribution but not where those values occur in the image.
Axes and scale
SideScopes counts each red, green, and blue code value into 256 bins. The horizontal axis runs from minimum channel value on the left to maximum on the right. Height represents the relative number of samples in a bin.
The displayed height uses a square-root response so a large population does not flatten every smaller one. This makes sparse parts of the distribution visible, but means bar height is not linearly proportional to sample count.
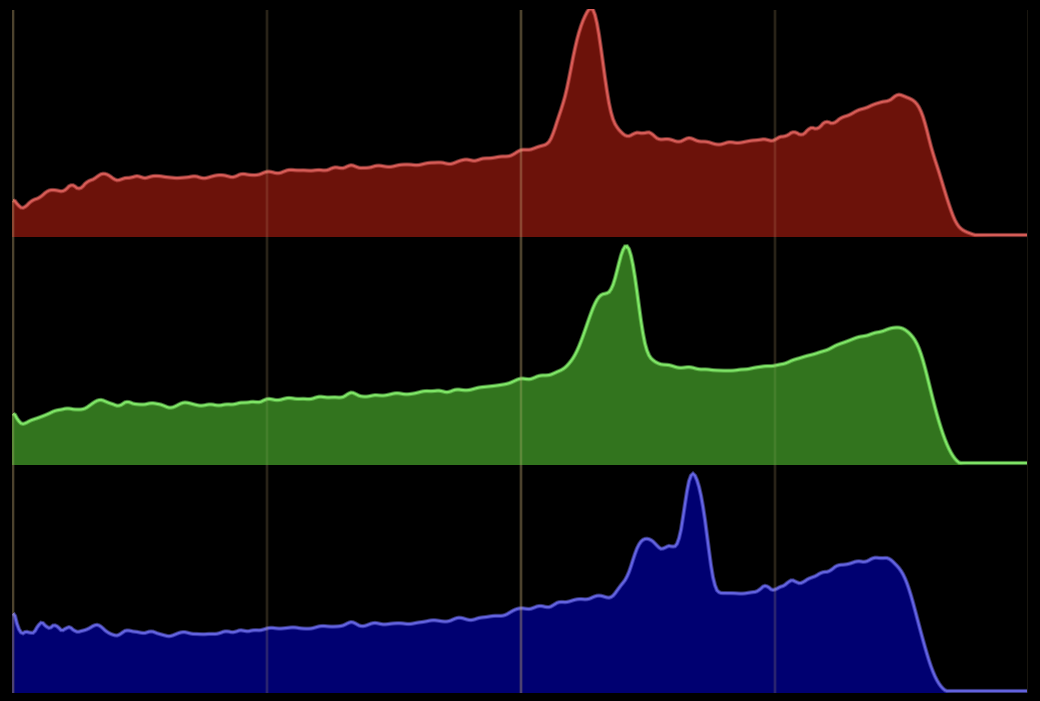
Per Channel and Combined
Per Channel gives red, green, and blue separate vertical bands, preserving the complete shape of each distribution. Combined overlays all three at the full plot height, making overlap and divergence easier to see. The underlying counts are the same; only the presentation changes.
Overlapping channel distributions can be consistent with neutral content, but they do not prove neutrality. Different colored subjects can produce similar global distributions, just as a neutral image can contain locally separated channels. Use a positional scope or a restricted region when location matters.
Peaks, gaps, and endpoints
A peak means many sampled channel values fall in or near that bin. It may come from a large flat area, a tonal compression, or simply the subject. A gap means the sampled output contains few or no values in that interval. Gaps can result from quantization or strong processing, but they do not by themselves prove posterization will be visible.
Likewise, a high endpoint count shows that many captured values are exactly at minimum or maximum. It can be consistent with crushing or clipping in the rendered output, but it can also describe legitimate flat black, white, or fully saturated pixels. The histogram cannot identify the limiting stage or recoverable data upstream.
When to use it
The histogram is compact and useful for comparing overall channel distributions, especially across similarly framed images. It is a poor tool for locating a problem: a small bright object and a broad bright band can contribute the same count. Use Waveform when horizontal position is relevant and Vectorscope when the question is chroma rather than channel level.
Reference: Adobe’s official Lumetri scopes guide describes histogram axes and the distinction from positional waveforms.